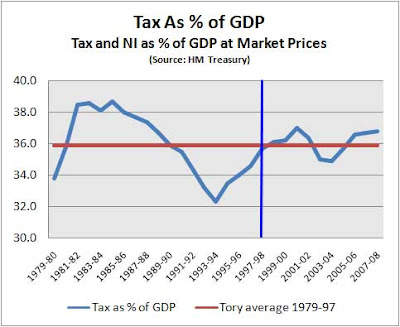
The TPA's paper on the Great British Taxpayer Rip-Off got quite a bit of press coverage, enough to elicit some dismissive comments from the Treasury. For example, asked about the TPA's calculation that Labour has racked up the real tax burden by 51%, HMT responded:
"Tax as a percentage of GDP is around the same level as it was in 1997 and is well below the peak of the 1980s. As a result of tax and benefit changes since 1997, four in ten families pay no net tax and this year's council tax increase is the lowest for over a decade."
On closer inspection, this turns out to be a classic series of non-sequiturs and half-truths that's well worth unpacking:
-
- On their own figures, tax as percentage of GDP is not "about the same level" as in 1997: it's about 1% higher, or about £15bn pa, and while that may be trivial to HMT, it represents £600 pa per household, a considerable burden on the average family.
-
- While it is true that the tax ratio is "well below the peak of the 1980s" (38.7% in 1984), that peak reflected Thatcher clearing up the fiscal mess left by the last Labour government - taxes were hiked in 1981 in order to get the public finances back onto a sustainable long-term footing; however, looking over the whole 18 years of Tory government, the average tax/GDP ratio was 35.9%, a full 1% lower than what Mr Brown grabbed last year (see chart above).
- "This year's council tax increase is the lowest for a decade"... hmm yes... but this year's increases in many other taxes, including Business Rates, are among the highest for a decade.
But the real doozy is the claim that "as a result of tax and benefit changes since 1997, four in ten families pay no net tax".
To start with, it's unclear quite what they mean: virtually everybody pays net tax of one kind or another. But let's assume they're basing their claim on the annual ONS analysis entitled The effects of taxes and benefits on household income. The latest one published shows that for 2005-06, the bottom four income deciles of working age households with children (ie four out of every ten "families") paid less in direct tax than they received in cash benefits.
In other words, they got back more in welfare cash from the government than they paid out in income tax, National Insurance, and Council Tax. Which, if you're happy to stretch language like a Treasury spinnner, is sort of equivalent to paying "no net tax" (setting aside all the other indirect taxes people pay, of course).
But, and this is A BIG BUT...
...back in 1997-98, before Mr Brown's huge and hideously complex tax and benefit changes, the proportion of families paying no net tax on this definition was... er... exactly the same: four out of every ten (see here). In other words, all that costly tinkering has achieved precisely nothing. The exact opposite of what the Treasury implies.
Now, as we all understand, the Treasury has always been economical with information. But surely it never used to mislead on this scale. Let's hope George Osborne really means what he says about that independent fiscal monitoring office. We desperately need some official source we can more or less trust.
PS Why are taxes, on 37% of GDP, so much lower than spending, on 42%? First, borrowing (aka deferred taxation) is now running at nearly 3% of GDP. And second, "other receipts" - not counted as taxes, but including all those ballooning public sector service charges - are now well over 2% of GDP. Taken together, they account for the 5% gap between tax and spend.
