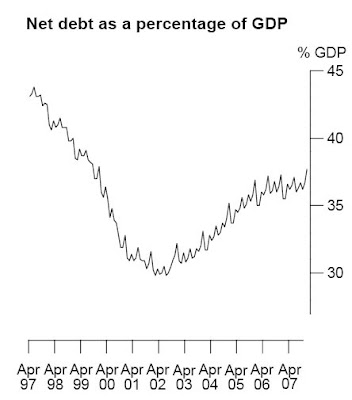
We've updated BOM's estimate of the Real National Debt. That's the total debt taxpayers are actually committed to paying, as opposed to the much smaller figure Brown admits to in the official statistics.
But before we start, and just for fun, let's remind ourselves of what the Great Enron Accountant told us in his 2001 pre-election Budget speech:
“From the unacceptable level of debt we inherited — debt at 44 per cent of national income — I forecast debt in the coming year will fall to 30.3 per cent and in the following years I project 29.6, 29.7, 29.9 and 30 per cent successively. . . putting Britain in a far stronger position to deal with the ups and downs of the economic cycle”
And can't you just picture his smile of satisfaction as he said it.
He's constantly reminded us how thanks to him, we've had the longest unbroken period of economic growth since the dawn of civilisation. Yet the government's debt has gone on increasing, and we're now facing the first economic downturn for nearly two decades with all credit cards maxxed.
We start with the official National Debt- Brown's figure, as published by the Office for National Statistics and charted above. When last sighted (figures up to Dec 2007), that was £536.5 billion, or 37.7% of GDP. So still within Brown's 40% rule. But...
We first need to add PFI debt. According to HM Treasury, its discounted present value is now £91bn, but since that ignores this year's new commitments and all payments beyond 2031-32, we'll round it up to £100 bn (see this blog), of which a mere £5bn has been counted in by the ONS.
Next up, we must add the liability for those unfunded public sector pensions (eg see this blog). According to the latest estimate from the IEA, that's another £1,025 bn.
Then we have the cost of decommissioning our old nuclear power stations. That's an explicit taxpayer liability we reckon comes in at around £70bn (see this blog).
And don't forget Northern Rock's £100bn debt, now formally added to the public sector balance sheet by the ONS, even though they haven't yet crunched the precise numbers (see this blog).
Add in Network Rail's debt at around £21bn, all fully guaranteed by taxpayers but excluded from the government's balance sheet.
The grand total is £1,847.5bn. Or 130% of GDP.
Or £74,000 of public sector debt hanging round the neck of every single household in Britain.
PS Even our £1.85 trillion figure excludes one of the really scary numbers. As we've blogged before, if we include the commitment to pay those totally unfunded state pensions, the total debt figure increases to around £9 trillion. Or £360,000 for every household
